
Graphiques interactifs
ggplotly (plotly)
Vous savez réaliser des graphiques avec ggplot2 ? Vous savez faire un graphique interactif. Rien de plus facile avec la fonction ggplotly de l’extension plotly.
Créons un graphique.
library(ggplot2)
p <- ggplot(iris) + aes(x = Petal.Width, y = Sepal.Length, color = Species) +
  geom_point()
Voici son rendu classique avec ggplot2.
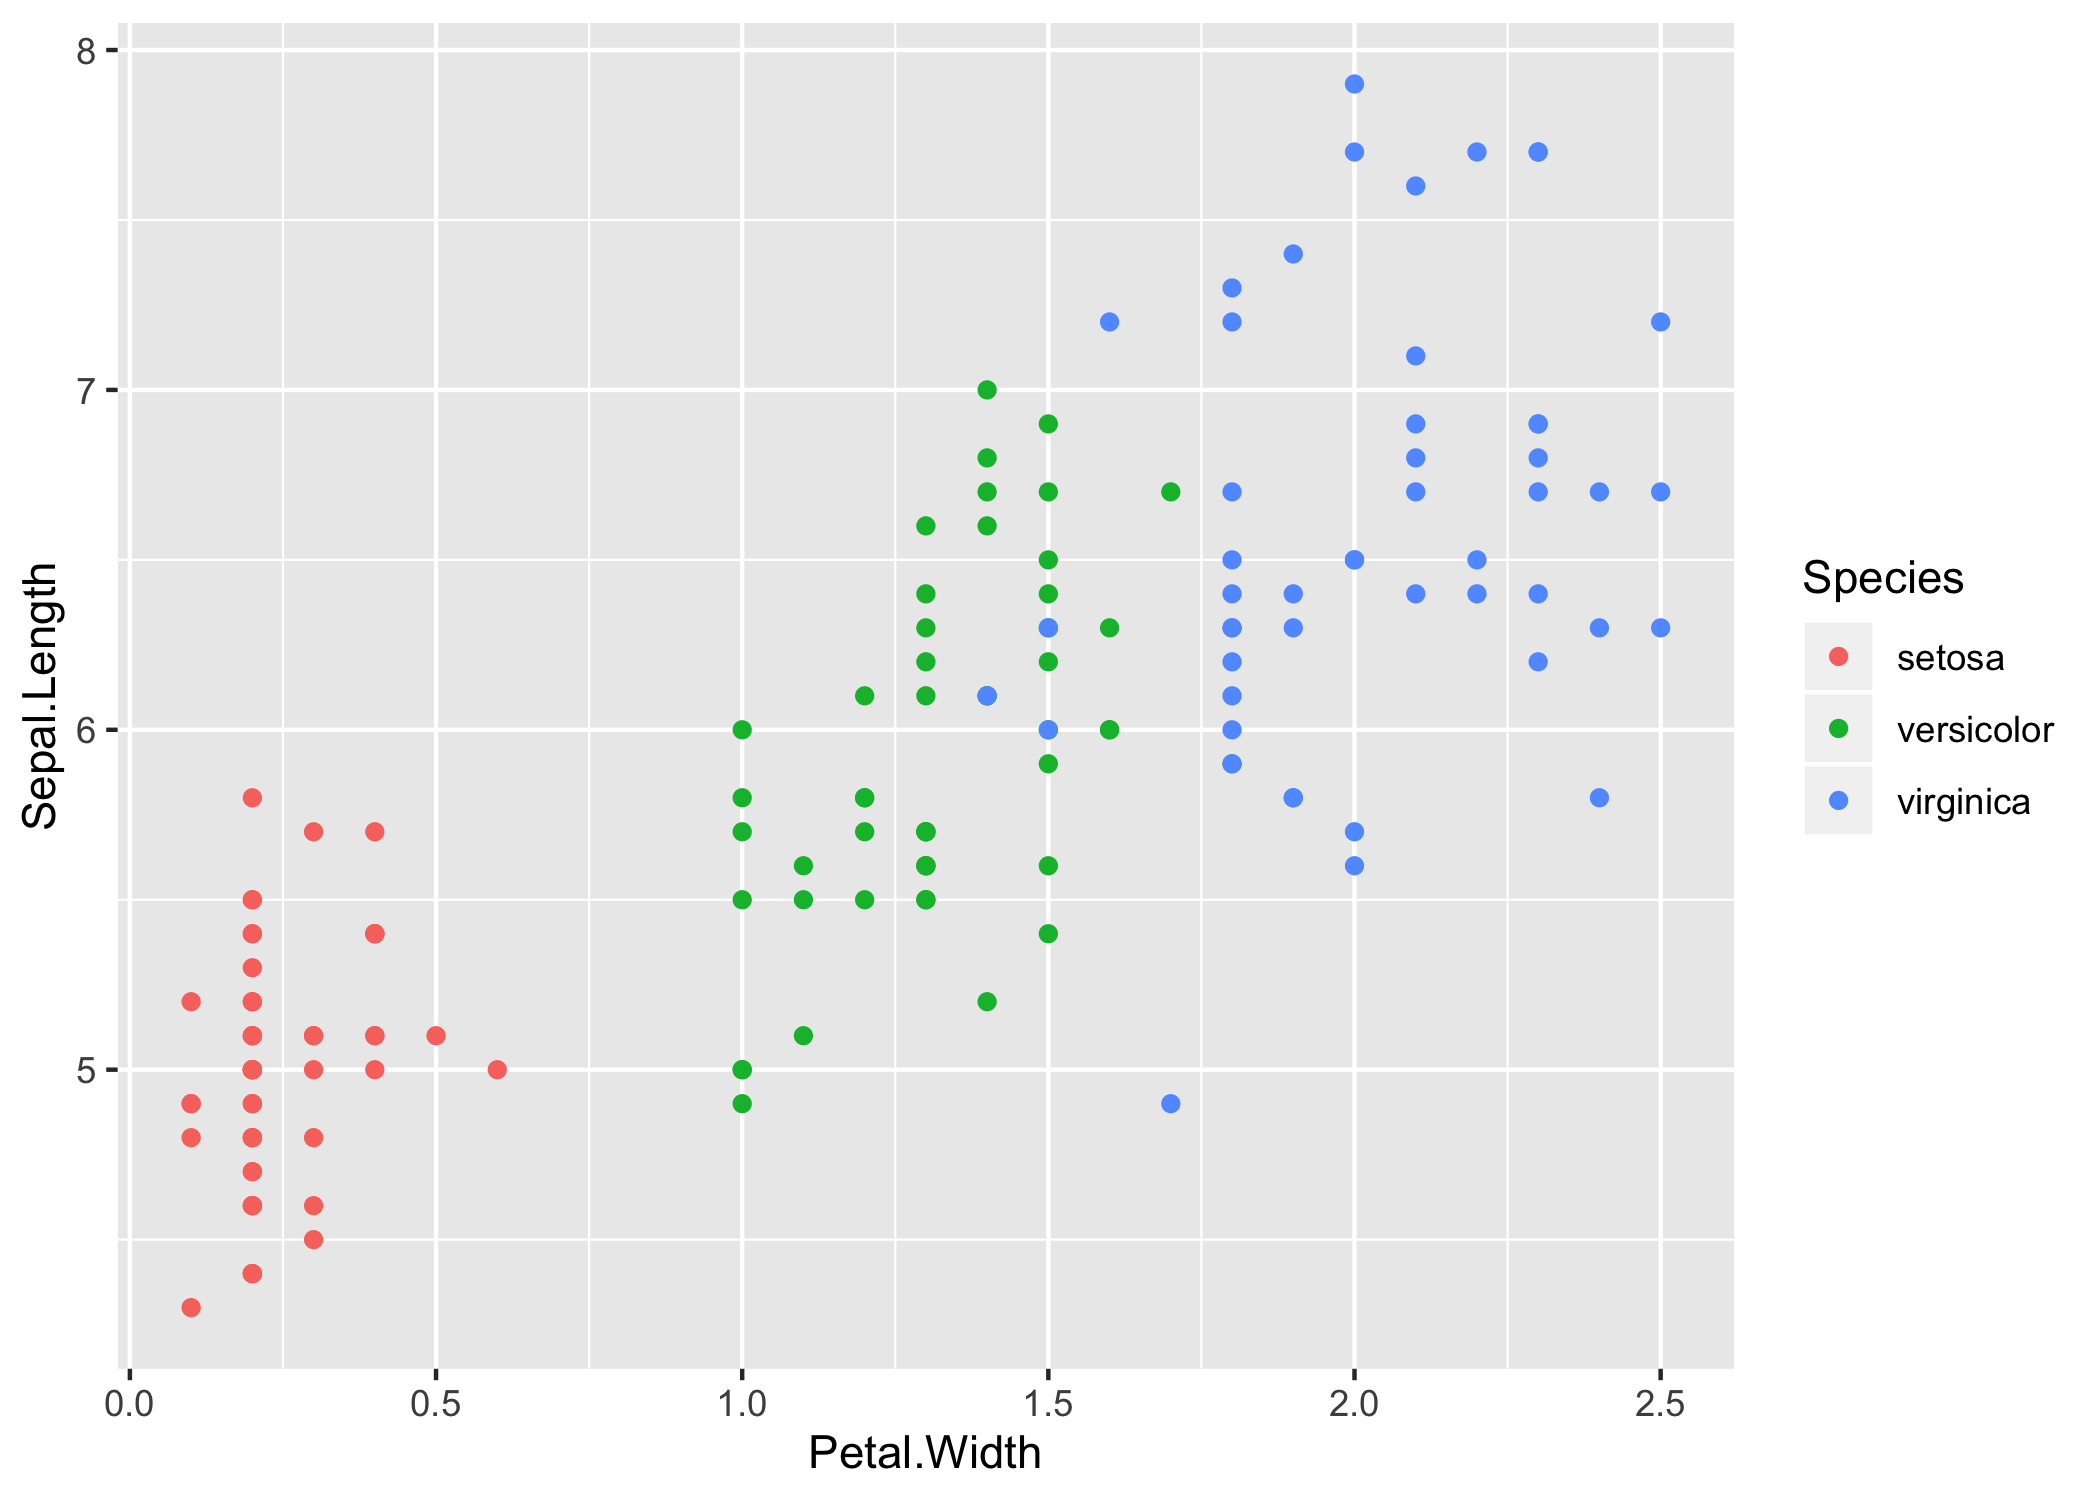
Et si on passe notre graphique à ggplotly. (N’hésitez pas à faire passer le curseur de votre souris sur le graphique.)
Attaching package: 'plotly'The following object is masked from 'package:MASS':
selectThe following objects are masked from 'package:plyr':
arrange, mutate, rename, summariseThe following object is masked from 'package:ggplot2':
last_plotThe following object is masked from 'package:stats':
filterThe following object is masked from 'package:graphics':
layoutUne documentation complète sur ggplotly est disponible sur https://plot.ly/ggplot2/.
ggvis
Il existe également une extension ggvis dédiée aux graphiques interactifs. Sa documentation complète est disponible sur https://ggvis.rstudio.com/.